
Ukraine's power system has taken a serious hit, making reliable energy storage a real concern for businesses, communities, and those working with renewables. The International Energy Agency’s 2024 report, titled "Ukraine’s Energy Security and the Coming Winter," talks about significant damage to power generation capacity and how tough it is to keep electricity steady and dependable. Because of all this, the quality of the equipment you use and local support really matter now.
According to the IEA’s Batteries and Secure Energy Transitions report, worldwide, we need to ramp up battery storage capacity about six times by 2030 to meet our energy and climate goals. But Ukraine’s situation is a bit different. You can’t just pick any system—things like the location, how the grid is set up, the way the system operates, and the harsh winter weather all play a part. For example, a weatherproof outdoor cabinet isn’t just tested by looking at specs; you really need to consider how well it performs in cold weather, what kind of controls it has, what the warranty covers, and if spare parts are easy to get.
This guide highlights seven different suppliers who serve the Ukrainian market and walks buyers through what to compare when choosing a system. We look at how well the systems integrate with existing setups, the quality of technical documentation, availability of service, and their experience with large-scale projects—whether for businesses or utilities. If you're in the market for an Energy Storage Systemin Ukraine, make sure to check out their project references and clarify who will handle things like installation, commissioning, and maintenance. Remember, a supplier’s claimed capacity is just part of the story—so is the price. It’s important to verify their claims because some project details are hard to compare fairly. It’s good to recognize that some level of uncertainty is normal. Ultimately, a properly matched Energy Storage System can really boost resilience, but it won’t guarantee constant power unless it’s carefully designed, installed, and operated.
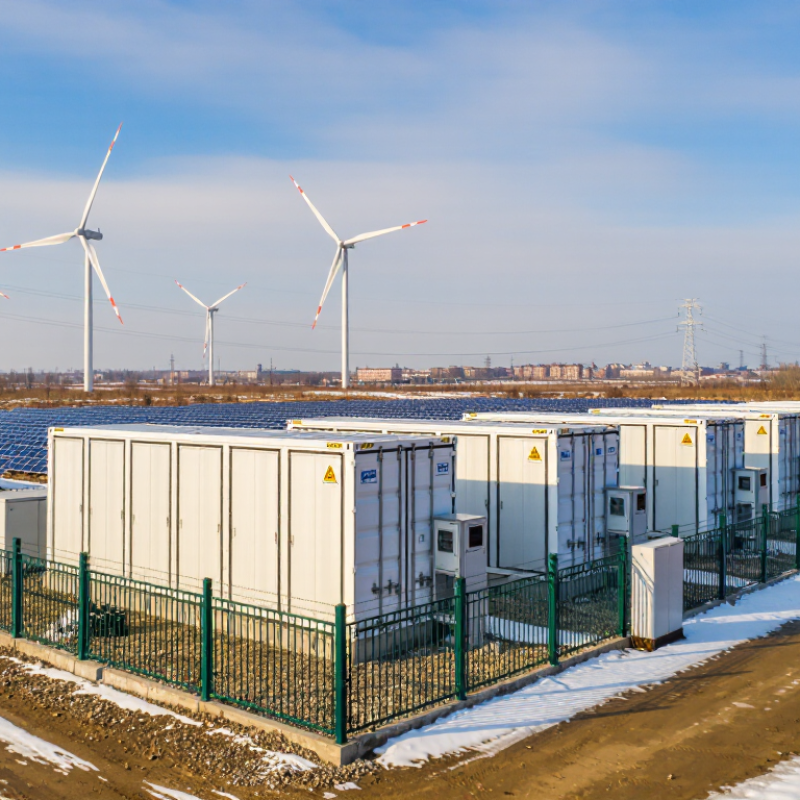
Ukraine had about 8 GW of installed solar capacity by 2021, creating a substantial base for its energy transition. That figure describes nameplate capacity, not steady electricity delivered to homes or industry. Solar output changes with clouds, seasons, and daylight. Timing matters.
For project planners, an Energy Storage System Battery can store midday surplus and release it during evening demand. At a substation, storage may smooth sharp output changes and support local balancing, depending on grid conditions and control systems. Battery duration, inverter capability, temperature management, and maintenance access all affect real-world performance. Not just capacity. Buyers should compare usable energy, warranties, safety documentation, and after-sales support, rather than relying on headline megawatt-hours alone.
The 8 GW estimate needs context: it does not show how much capacity remained operational or where it was connected. That uncertainty matters. Site-level data, grid connection studies, and realistic dispatch assumptions make supplier comparisons more credible. Storage is not a cure-all; a poorly matched system can add cost without easing the actual constraint.
Ukraine’s installed solar capacity grew from about 0.7 GW in 2017 to about 8.1 GW in 2021. As variable solar generation expands, energy storage can help shift electricity to times when it is needed.
Source: IRENA, Renewable Capacity Statistics 2022. Capacity figures are rounded to the nearest 0.01 GW.
For buyers comparing energy storage system suppliers in Ukraine, separate MW from MWh. MW measures how much power a battery can deliver at one moment. MWh measures its stored energy. A 10 MW / 20 MWh system can theoretically discharge at full power for two hours. Real delivery may be shorter because of conversion losses, reserve settings, and temperature controls. The IEA’s Batteries and Secure Energy Transitions (2024) reports that global battery storage additions reached 42 GW in 2023, rising more than 130% year on year. Scale is growing quickly.
A 1–4-hour discharge rating describes duration at a stated output, not guaranteed backup time for every load. For example, a 5 MW system with 10 MWh of usable energy provides about two hours at 5 MW. Lowering output can extend runtime, but site demand changes constantly.
Check whether quoted capacity is usable energy or nominal capacity. Also ask how the inverter, cooling equipment, and battery controls handle repeated cycling. Specifications can look clean on paper; operating conditions are less tidy.
Tips: Compare usable MWh, rated MW, discharge duration, and efficiency under the same test conditions. Ask for performance guarantees at the site’s expected temperatures.
Lithium-ion systems are often quoted at 85–95% round-trip efficiency. That range is a benchmark, not a promise. It describes how much stored electricity can be returned after charging, but test boundaries matter. Some figures cover battery cells alone; others include conversion equipment and controls. Ask suppliers which measurement they use.
For an Energy Storage System Lithium Battery project in Ukraine, compare efficiency at the system level and under realistic operating conditions. In winter, colder equipment rooms or outdoor cabinets may affect performance unless temperature control is properly designed. Frequent cycling, standby consumption, and partial loads can also change results. Request test data showing charge and discharge power, ambient temperature, and measurement points. Small details count. A dashboard showing 92% may look reassuring, yet it can omit auxiliary loads. I would check the assumptions twice; product sheets are tidy, operating sites less so. Ask for warranties and independently verifiable test reports, then compare systems using the same method.
When comparing energy storage suppliers in Ukraine, ask for evidence behind each safety claim. IEC 62619 covers safety requirements for industrial lithium cells and batteries, including stationary applications. Request test reports that identify the tested cell or battery model, not just a certificate image. A mismatch between the report and quoted equipment deserves a clear explanation.
IEC 62933 addresses electrical energy storage systems at system level. For electrochemical installations, ask which relevant parts and editions were used, and how the supplier assesses hazards such as overheating, electrical faults, and ventilation needs. UN 38.3 is different: it concerns transport testing for Lithium Batteries. It does not prove that a completeEnergy System is safe to operate. Paperwork matters, but it cannot replace sound installation and maintenance. That distinction is easy to miss.
Tips: Check model numbers, test dates, and report scope. Ask who handles commissioning and emergency procedures. Get answers in writing. A supplier may have strong documents yet weak site support; that gap should prompt more questions.
Comparing seven energy storage suppliers in Ukraine requires more than ranking headline capacity. MW shows how much power a system can deliver at once; MWh indicates how long it can sustain that output. A 10 MW, 20 MWh installation, for example, can run at full output for about two hours under ideal conditions. Check whether quoted figures are usable capacity or nominal capacity, and whether performance changes with temperature or operating limits.
Warranty terms deserve equal attention. Compare years covered, cycle or throughput limits, retained-capacity guarantees, and exclusions for frequent cycling. Ask for the warranty document, not just a sales summary. Small wording differences matter. A long warranty may offer little protection if service response times, replacement parts, or labor are excluded.
For each supplier, request references for projects of similar size and operating conditions, plus a clear service plan for Ukraine. It should identify local technicians, remote monitoring arrangements, spare-parts access, and escalation times. Ask how the system handles winter temperatures, grid interruptions, and site-specific fire-safety requirements. These details should be confirmed by qualified engineers and documented before procurement. Supplier data is not always presented consistently, so a comparison table may still contain gaps. Flag them rather than filling them with assumptions.
For Ukrainian projects, compare storage proposals by delivered energy, not headline capacity. A 100 MWh battery does not deliver 100 MWh to the grid after conversion losses and reserve limits. NREL’s 2024 Annual Technology Baseline uses approximately 85% round-trip efficiency for utility-scale battery storage. That is a useful reference, not a guarantee for every site. Ask suppliers to state efficiency at the point of connection, including cooling and other auxiliary loads. Small losses add up.
Cycle life also needs context. Request the warranted cycles alongside depth of discharge, operating temperature, and retained capacity at the warranty endpoint. A high cycle count can look attractive while assuming shallow daily use. For a Solar Power Storage System, model seasonal charging patterns and cold-weather heating demand; both can change usable output and replacement timing. Lazard’s 2024 Levelized Cost of Storage analysis placed four-hour standalone lithium-ion storage at roughly $124–$210 per MWh. Treat this as a benchmark, not a Ukrainian tariff: financing, grid connection, degradation, and charging costs differ by project. Calculate levelized storage cost using the same lifetime, efficiency, and replacement assumptions for every bid. A spreadsheet can still flatter a weak project. I would also stress-test lower utilization; it is easy to overlook when forecasts assume ideal dispatch.
The entries below are anonymized technology and supplier-solution profiles, not named companies or supplier-verified quotations. Performance and cost figures are indicative screening ranges for project comparison; actual results depend on system design, operating conditions, warranties and local project costs.
| Profile | Typical system configuration | Indicative cycle life | Typical round-trip efficiency | Indicative LCOS (USD/MWh) | Potential project fit in Ukraine | Key evaluation point |
|---|---|---|---|---|---|---|
| 1. Utility-scale LFP integrator | Lithium Iron phosphate (LFP), containerized battery system; commonly configured for approximately 2–4 hours of discharge | About 6,000–10,000 cycles, depending on depth of discharge, temperature and operating strategy | About 88–94% | $100–180/MWh | Grid balancing, renewable-energy shifting and backup for critical facilities | Check warranted usable capacity, thermal management, degradation assumptions and local service capability. |
| 2. High-energy lithium-ion solution | Nickel manganese cobalt (NMC) battery system; typically selected where compact installation is important | About 3,000–6,000 cycles, depending on cell design and operating conditions | About 88–95% | $130–220/MWh | Space-constrained sites and projects requiring high energy density | Compare fire-safety provisions, usable energy, replacement strategy and warranty limits. |
| 3. Vanadium flow-battery solution | Vanadium redox flow battery; energy capacity can be increased through larger electrolyte tanks | Typically 10,000 or more cycles; stack and balance-of-plant maintenance still matter | About 65–85% | $180–350/MWh | Long-duration stationary storage with frequent cycling and a larger installation footprint | Assess efficiency, auxiliary loads, electrolyte management and total installed cost. |
| 4. Zinc-based stationary storage solution | Rechargeable zinc-based battery system, with performance varying by chemistry and system design | Approximately 5,000–10,000 cycles for some stationary designs; verify the specific product warranty | About 70–85% | $160–300/MWh | Projects prioritizing stationary operation and alternative chemistry options | Request independently supported cycle-life data and clarify the conditions used for testing. |
| 5. Sodium-ion storage solution | Sodium-ion battery system; commercial availability and product maturity vary by supplier | Approximately 3,000–8,000 cycles, depending on cell chemistry and duty cycle | About 85–92% | $140–260/MWh | Emerging projects evaluating alternatives to lithium-based battery supply chains | Confirm bankability, delivered project references, certification and long-term service arrangements. |
| 6. Lead-carbon stationary solution | Advanced lead-carbon battery system for stationary, moderate-duration applications | Approximately 1,500–3,000 cycles, depending on depth of discharge and maintenance regime | About 75–85% | $180–350/MWh | Smaller backup and microgrid projects where familiar maintenance practices are useful | Compare lifetime energy throughput, replacement frequency and end-of-life handling costs. |
| 7. Repurposed-battery integrator | Second-life lithium-ion battery packs assembled into a stationary storage system | Approximately 2,000–5,000 additional cycles; strongly dependent on pack history and screening | About 80–90% | $130–260/MWh | Cost-sensitive pilots or projects able to accommodate additional testing and monitoring | Require transparent battery provenance, state-of-health testing, safety controls and a clear warranty. |
LCOS means levelized cost of storage and is shown here as a broad planning range, not a project quote. A bankable comparison should use consistent assumptions for installed cost, financing, charging energy, dispatch frequency, degradation, replacements, efficiency, grid connection and taxes.
MW measures power at a moment. MWh measures stored energy. A 10 MW / 20 MWh system could theoretically run at full power for two hours.
No. It describes duration at a stated output. Actual runtime depends on demand, losses, reserves, and temperature controls.
Nominal capacity is not always fully available. Ask for usable MWh and the conditions used to measure it. Details matter.
A system rated at 100 MWh may deliver less after conversion losses and reserve limits. Cooling equipment also uses energy. Small losses add up.
Compare round-trip efficiency at the point of connection, including auxiliary loads. Around 85% is a reference, not a site-specific promise.
Check warranted cycles alongside depth of discharge, operating temperature, and retained capacity at the warranty endpoint. A large cycle count can assume shallow daily use.
Heating demand and temperature controls can reduce usable output. Model seasonal charging patterns, especially during colder months. Forecasts can be too neat.
Use the same lifetime, efficiency, replacement, and charging-cost assumptions for every bid. Include financing and grid connection costs, then test lower utilization. I might miss that.
With about 8 GW of solar capacity installed by 2021, Ukraine has a strong foundation for expanding energy storage to help balance variable generation and improve power availability. Battery energy storage systems are described by both power output, measured in megawatts, and stored energy, measured in megawatt-hours; many projects are designed to discharge for one to four hours. Lithium-ion systems commonly achieve round-trip efficiency of approximately 85–95%, although actual performance depends on design and operating conditions.
This overview compares seven Ukrainian suppliers using practical criteria such as system scale, warranty coverage, and service support, without relying on brand rankings alone. It also highlights the importance of assessing safety documentation, including IEC 62619, IEC 62933, and UN 38.3, alongside cycle life and efficiency. For any Energy Storage System Supplier Ukraine, buyers should consider the levelized cost of stored energy over the system’s useful life, rather than focusing only on its initial purchase price.

